S.K-2.C.1.1.1: Describe basic changes to properties of matter (e.g. formation of mixtures and solutions, baking and cooking, freezing, heating, evaporating, melting.
S.K-2.A.2.1.2:
Describe outcomes of an investigation.
S.K-2.A.2.1.1:
Understand that making a change to an investigation may change the outcome(s)
of the investigation.
3.1.2.C4:
·
Distinguish between scientific fact and opinion.
·
Ask questions about objects, organisms, and events.
·
Understand that all scientific investigations involve
asking and answering questions and comparing the answer with what is already
known.
·
Plan and conduct a simple investigation and understand
that different questions require different kinds of investigations.
·
Use simple equipment (tools and other technologies) to
gather data and understand that this allows scientists to collect more
information than relying only on their senses to gather information.
·
Use data/evidence to construct explanations and
understand that scientists develop explanations based on their evidence and
compare them with their current scientific knowledge.
·
Communicate procedures and explanations giving priority
to evidence and understanding that scientists make their results public,
describe their investigations so they can be reproduced, and review and ask
questions about the work of other scientists.
Along with the experiment I am focusing on the Scientific Method, I created a graphic organizer for the students to complete as I do my lesson and we are going to create an anchor chart together as well. I liked this concept because I thought it would be great for in a real classroom to have each student complete a graphic organizer of the Scientific Method that they can look back to, but have an anchor chart that we created as a class to hang up for future reference. Attached below is my graphic organizer and some pictures of the experiment!
First for the experiment you will need
- Baking Soda
- Vinegar
- Food Coloring
- Cups
- Some type of container or pan to catch the explosion
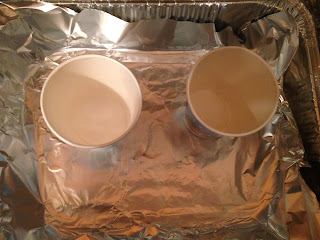
In the two cups that are placed in the silver pan I put baking soda into them, enough to cover the bottom of the cup. Then I filled two separate cups with vinegar and added about 5 drops of food coloring in each. For my lesson I am focusing on primary colors mixing together so I chose yellow and blue to create green.
Then I poured the two cups of vinegar with the food coloring into the cups of baking soda to create the explosion.
I am also focusing on how the colors mixed together to make green for my lesson.


No comments:
Post a Comment